Your House Got More Expensive and You Got Poorer
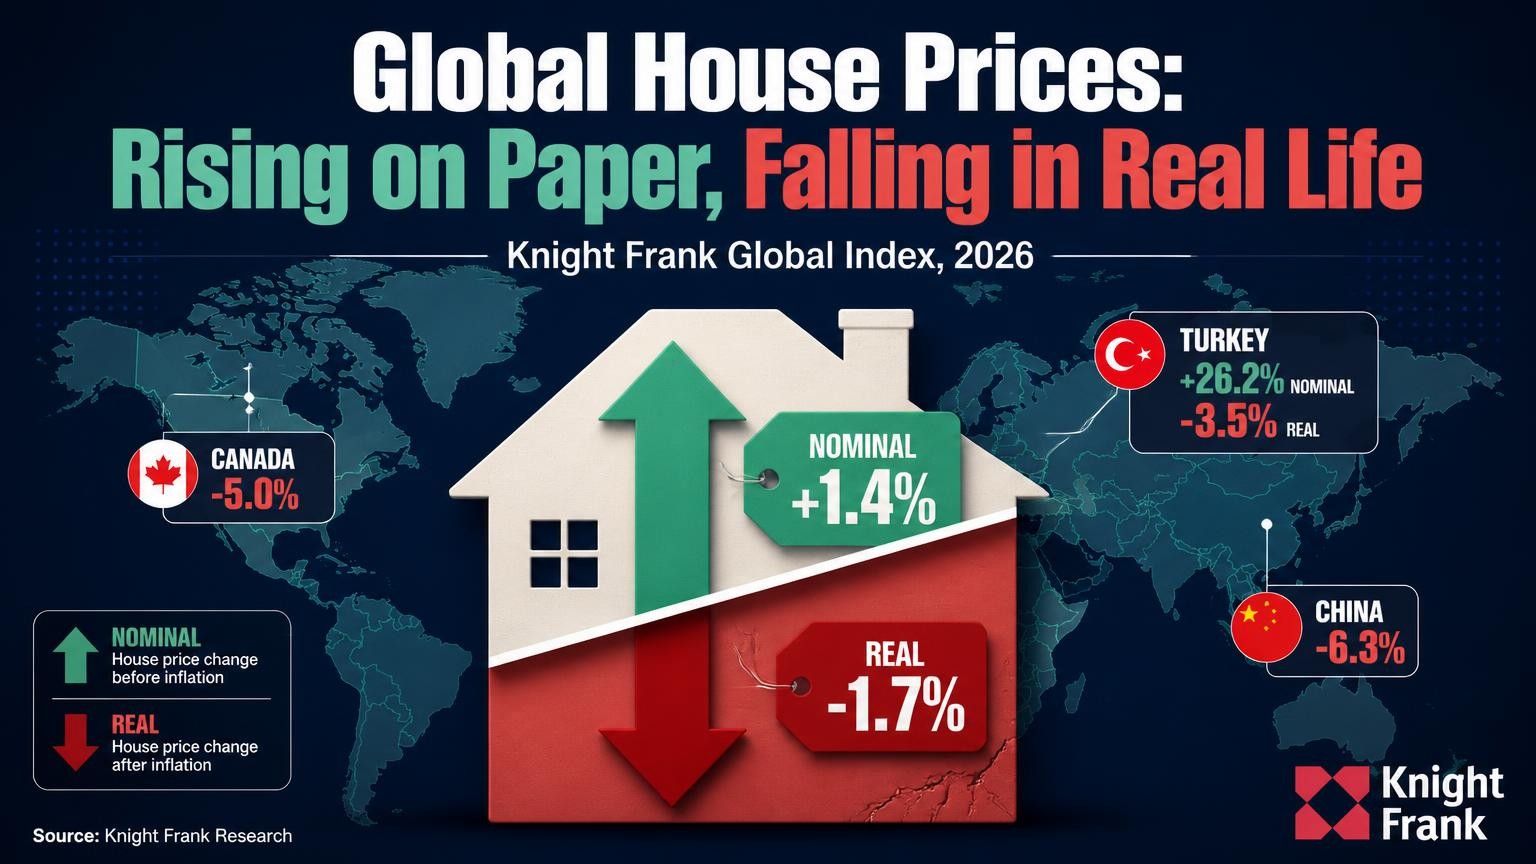
Knight Frank's Global House Price Index tracks 55 markets, and its first quarter 2026 reading is a lesson in how numbers can smile while wallets frown. Average annual global house price growth slowed to 1.4%, down from 2.3% in the previous quarter and the weakest since the third quarter of 2024 (Bailey, 2026).
Here is the trick. A total of 91% of markets recorded positive annual nominal growth, up from 87% (Bailey, 2026). But in real terms, the global index fell 1.7%, compared with a fall of 0.3% in the previous quarter. Prices are up on paper, and your wallet has not been invited to the party.
Turkey Wins the Trophy and Loses the Money
Turkey topped the table with 26.2% nominal growth, yet its real prices fell 3.5% (Bailey, 2026). Hungary followed at 21.4%, then Portugal at 16.5% and Croatia at 16.1% (Knight Frank, 2026).
| Turkey | 26.2% |
| Hungary | 21.4% |
| Portugal | 16.5% |
| Croatia | 16.1% |
At the other end, Mainland China fell 6.3% and Canada fell 5.0% (Knight Frank, 2026). Central banks made 11 rate cuts and four hikes in the quarter, so borrowing costs are easing in some places, but affordability pressures have not fully eased because inflation absorbs much of the nominal growth in several markets (Bailey, 2026).
The Rich Have a Group Chat, and Its Main Office Is in Dubai
At the top end, super prime activity hit its highest level in a year, with 636 transactions in the first quarter, up 14% from the previous quarter (Bailey, 2026). Dubai logged 193 sales, Hong Kong 94 and New York 90, and those three markets made up almost 60% of the total.
Knight Frank notes that liquidity remains concentrated in a small number of globally connected wealth hubs. It also warns that Dubai's figures mostly reflect January and February, before the regional conflict that began on 28 February, so the second quarter may tell a different story (Bailey, 2026).
Prices are up on paper, and your wallet has not been invited to the party.
What You Can Actually Do About It
Before you celebrate or panic over a house price headline, check whether the number is nominal or real. If you own, compare your gain with what everyday costs have done since you bought. If you are buying, test your plan against mortgage rates and your own budget rather than the national average. Treat luxury market headlines as news about a handful of cities, not yours. Then ask yourself, if your home value rose but your costs rose faster, would you feel richer?
References
Bailey, L. (2026, July 3). Super-prime's centre of gravity shifts. Knight Frank. https://www.knightfrank.co.uk/research/article/2026/7/super-primes-centre-of-gravity-shifts
Knight Frank. (2026). Global house price index, Q1 2026. Knight Frank. https://www.knightfrank.co.uk/site-assets/research/report-pdfs/global-house-price-index/ghpi-2026-q1.pdf

Comments (0)
No comments yet — be the first to comment.
Leave a comment