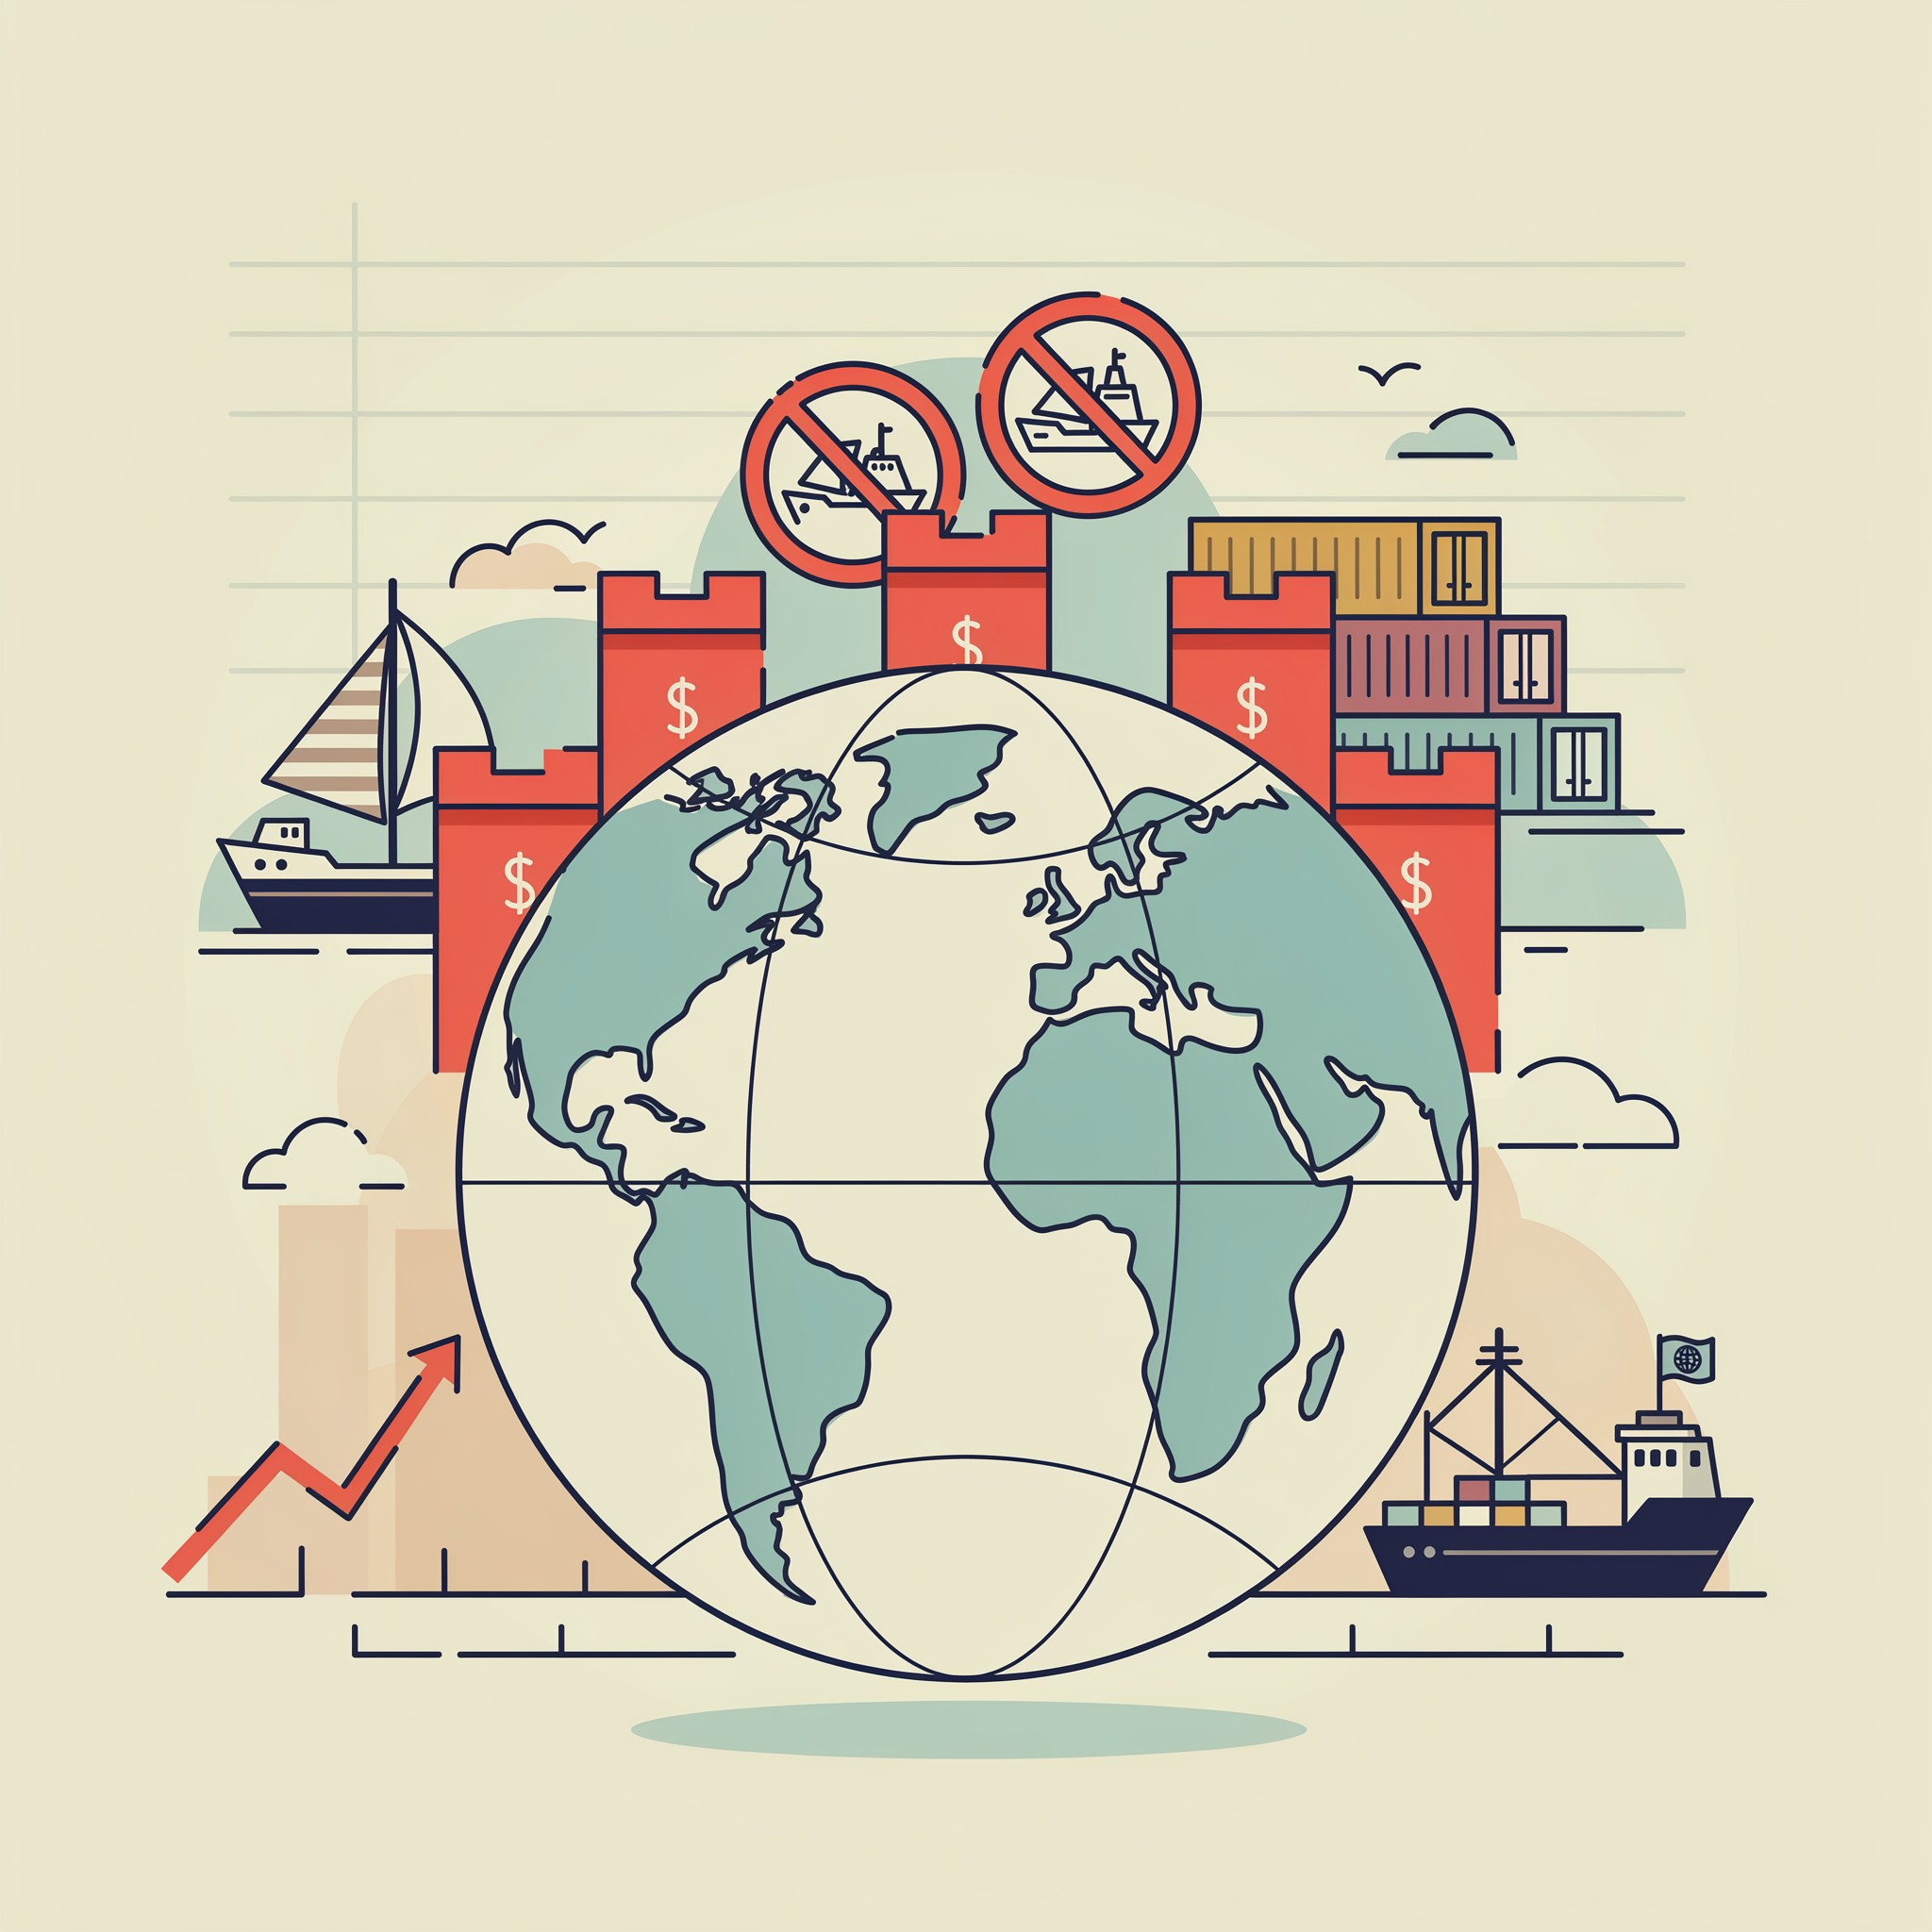
A Number That Quietly Broke A Record
Trade policy does not usually move fast enough to make for dramatic headlines, but the new Trade Policy Activity Index built jointly by WTO and IMF economists just posted its highest reading since data collection began after the 2008 financial crisis (WTO, 2026). Averaged over January through May 2026, global trade policy activity ran nearly twice its 2024 level and roughly a quarter above its 2025 average, and the increase shows up across 197 countries and territories, not just the largest economies (WTO, 2026).
Restriction Is Doing All The Heavy Lifting
The index separates facilitating measures, the kind that ease trade by lowering barriers or improving customs procedures, from restrictive measures like tariff hikes, import bans, and subsidies, and the data is blunt about which side is driving the surge. Facilitating measures have lost relative momentum for years, while restrictive measures and subsidies have climbed steeply through 2025 and into 2026, with the divergence between the two widening every quarter (WTO, 2026). This is not an abstract statistical trend for the businesses caught inside it. The United States recently imposed new Section 301 tariffs on its top 60 trading partners over forced labor concerns, covering more than 99 percent of all US imports, and separately hit roughly 20 billion dollars of Canadian goods including wine, dairy, cement, and sporting equipment with 50 percent tariffs under a provision of the Tariff Act of 1930 that had not been used since it was written nearly a century ago (World Economic Forum, 2026).
Who Pays For A System Being Rebuilt In Real Time
There is a genuine fairness concern sitting underneath the aggregate numbers. Smaller and less diversified economies are the most exposed to rising costs and volatility even though the sharpest policy swings tend to originate with G20 members, and countries with weaker infrastructure or less stable policy environments risk being sidelined entirely from supply chains that are actively being rebuilt around them right now (WTO, 2026). Not every response has been purely defensive. The European Union is launching a corporate advisory group this autumn specifically to help businesses share information on supply chain risk, and Australia and Singapore recently signed a protocol on economic resilience to strengthen cooperation on critical supply chains, both signs that some governments are choosing coordination over unilateral restriction even as the overall trend points the other way (World Economic Forum, 2026).
A System Reorganizing, Not Simply Shrinking
The most useful way to read this data is as a system actively reorganizing itself rather than one quietly closing down. Global merchandise trade still grew 1.9 percent in volume in the first quarter of 2026, helped by strong demand for AI related infrastructure like semiconductors and data transmission equipment, proof that rising restriction and rising trade volume can occur at the same time rather than canceling each other out (World Economic Forum, 2026).
What You Can Actually Do About It
If your work touches sourcing, compliance, or market entry, treat continuous trade policy monitoring as a core function rather than an occasional check, since the index shows this is the new baseline rather than a temporary spike to wait out. Ask yourself honestly whether your organization's current supplier list reflects a genuine risk assessment or simply years of habit, because that second answer is precisely what this data is quietly punishing right now.
References
WTO. (2026, July 23). Updated WTO IMF TPA index shows continued rise in global trade policy activity. https://www.wto.org/english/news_e/news26_e/rese_23jul26_463_e.htm
World Economic Forum. (2026, August 4). Interventions drive trade policy surge in 2026, and other trade news to know. https://www.weforum.org/stories/trade-and-investment/trade-policy-surge-and-other-trade-news-to-know/
Comments (0)
No comments yet — be the first to comment.
Leave a comment